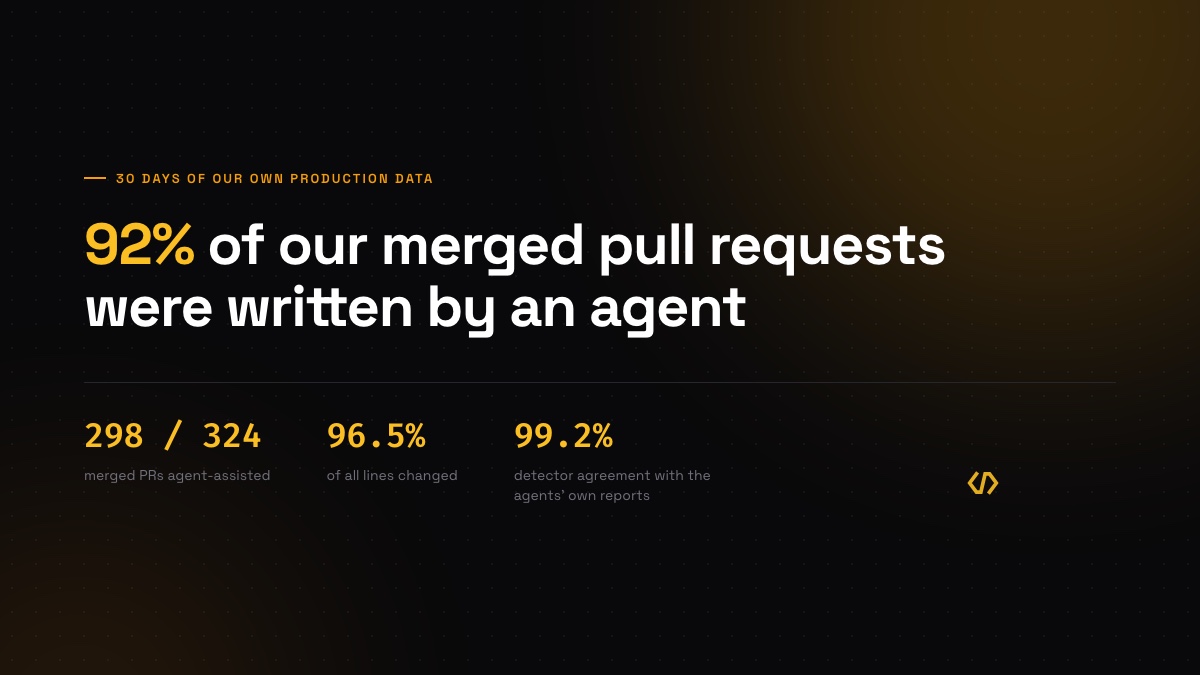
Here are three numbers from our own production data, for the thirty days to 13 September 2026.
Merged pull requests that were agent-assisted: 298 of 324, or 92%.
Share of every line we changed that came from those pull requests: 96.5%.
Number of them a human reviewed before merge: zero.
We build Coderbuds, which measures how engineering teams deliver, and we measure ourselves with it. That last number is not a typo, and we will come back to it, because it is the most interesting thing in the dataset and the least flattering.
#The Number You Cannot Check
Every vendor now reports an AI adoption figure, and almost none of them will tell you how it was produced.
There are two honest ways to get one. You can ask the tools — integrate with Copilot's admin API, with Cursor's enterprise endpoints, with whatever Claude Code exposes — and you inherit whatever those vendors choose to count, for whichever tools your team happens to pay for. Or you can infer it from the work itself: look at the diff, the commit cadence, the shape of the change, and score how likely it is that an agent wrote it.
We do the second one. We wrote about why — the short version is that API integrations fall apart on attribution the moment a developer's git email does not match their SSO identity, which is most of the time.
But inference has an obvious problem. It is a guess, and a guess with no error bar is indistinguishable from a number someone made up.
So we built the check in. Coding agents using our MCP server can declare their own usage after opening a pull request — which tool wrote it, and whether a person read the diff before it went up. That gives us something rare: a set of changes where we know the answer, sitting inside a set where we only inferred it.
Over the same thirty days, 133 changes carried a first-party declaration. Our detector agreed with the agent's own account 132 times. It missed one AI-assisted change and wrongly claimed none.
99.2% agreement. That is the number that makes the 92% worth reading. Not because 99.2% is high, but because it exists at all, and because it means every inferred figure we publish carries a stated error rate rather than an implied one.
We keep the two apart on purpose. The declared count is not blended into the inferred rate. Mixing a first-party number with a heuristic one gives you a figure nobody can explain to a board, which is the opposite of the job.
#Adoption on Its Own Is a Pilot Metric
Fifty per cent of our active contributors shipped agent-assisted work last month. Read alone, that is a vanity number. It counts who used a tool. It says nothing about whether the tool helped.
The useful question is what the work did once it shipped, so here is the split:
| Agent-assisted | The rest | |
|---|---|---|
| Merged pull requests | 295 | 15 |
| Median lines changed | 312 | 438 |
| Median lead time | ~0.1h | ~0h |
| Reached production | 218 | 1 |
Agent-assisted changes merged at effectively the same speed as the rest and were 28.8% smaller. That second one runs against the industry pattern — the widely cited finding is that AI-assisted pull requests get bigger, by as much as 154% — and we think the reason is boring rather than clever. We gate our own pull requests on a size and scope check before they are opened. The agent asks what fits here, gets told, and trims. The tool did not make changes smaller. A standard the tool has to read before it writes made changes smaller.
At the whole-team level: 513 deployments in thirty days, 13.5 a day, 42-hour lead time, a 20.9% change failure rate and a mean time to recovery of roughly 70 hours. Those last two are not good, and we are not going to dress them up. Deploying thirteen times a day means one in five deploys going wrong is survivable in a way it would not be at a weekly cadence, but a 70-hour recovery time is a real weakness and it is ours.
#The Number That Should Worry You
Back to the zero.
Of 295 merged agent-assisted pull requests, none received a human code review. Our own declaration data agrees: human_reviewed: false on every single report.
We could hide that. The tooling to hide it is right there — we could report review coverage as a percentage of pull requests that had any review event, count the automated verdict as a review, and print a number in the eighties. Plenty of tools do exactly that.
The reason not to is that this is precisely the failure mode the category is walking into. Faros AI's telemetry across roughly 22,000 developers found that pull requests merged with no review at all rose 31.3% as AI adoption climbed, while time in review rose 441.5%. Nobody decided that. A queue overflowed, and merging unreviewed is what overflow looks like in a git workflow.
Our version of that is smaller and starker: a very small team, an agent producing at a rate no single reviewer could absorb, and a review step that simply stopped happening. We are the extreme case of our own customer. That is uncomfortable, and it is also the whole reason our data is worth anything to you — we hit the wall first, on purpose, in public.
#What This Does to Engineering Measurement
Every instrument an engineering leader currently uses was built for a world where a human typed each line.
Pull request counts assumed a person's day bounded them. Review coverage assumed someone had to read it. Cycle time assumed the writing step was the expensive one. Contribution graphs assumed authorship meant something about a person.
None of those hold now. Output per developer stops being a measure of a developer. Review coverage stops being a measure of care and starts being a measure of reviewer capacity. And the question a CEO asks — what did engineering deliver this month — becomes genuinely hard to answer, because the majority of the diff came from something that cannot be asked what it did.
The answer is not to stop measuring. It is to measure the part that still has a human bottleneck in it, and to say plainly which numbers are inferred and how wrong they might be.
#We Wrote It Down as Nine Slides
We are applying to NVIDIA Inception, which wants a deck explaining the company's mission and where it fits in the market. Writing it forced the argument above into nine slides, which is a useful constraint — and having done the work, there is no reason to keep it to ourselves.
So here it is, the actual deck, unedited:
Download the deck (PDF, 9 slides) — or the print-friendly unbranded version if you would rather lift a slide into something of your own.
What is in it:
- The problem, with the third-party telemetry on what AI adoption did to delivery
- How the measurement loop works end to end — sources, engine, surfaces
- The four AI systems that run in production, including the detector described above
- The full dogfood dataset from this post
- Where we sit against Jellyfish, LinearB, Swarmia, DX, Faros and Waydev
- What we would do with self-hosted inference, and why it is the thing standing between us and enterprise buyers
Steal from it freely. If you are building the same argument for your own leadership team, the unbranded version exists for exactly that.
#What Is Not True About This Data
A short list, because a post like this is worthless without one.
The sample is tiny. One team, one to two active contributors. Every rate here is stable enough to quote and far too small to generalise from. Treat it as an existence proof, not a study.
The threshold is a choice. A pull request counts as agent-assisted at a likelihood score of 50 or above. That threshold is team-configurable, and moving it moves the 92%. We publish it for that reason.
The detector is still a detector. One miss in 133 is our measured error rate against ground truth, over one month, on one codebase, with one agent doing most of the writing. It will be worse on a team using four tools unevenly.
Lead time near zero is a property of this team, not of agents. One person merging their own work has no handoff. Do not read our 0.1-hour median as something a ten-person team should expect.
A 20.9% change failure rate is not a success story. It is the cost of the setup described above, and the thing we are working on next.
If you want the same numbers for your own team — the inferred rate, the declared rate, and the gap between them — that is what Coderbuds does. It takes about five minutes to connect a repository, and the first verdict posts the same day.